
Tasmania Wildfire Index — Statewide Data Engineering
Led statewide data preparation, analysis and delivery QA for Geoneon's published 2026 Wildfire Index, assessing 450,356 building footprints across Tasmania.
- Building footprints assessed
- 450,356
- Local government areas
- 29
- Suburbs
- 769
- My contribution
- Data & Analysis Lead
- python
- geospatial-data
- wildfire-exposure
- spatial-analysis
- remote-sensing
- network-analysis
- data-quality
Evidence
Overview
At Geoneon, I led the data-engineering work supporting the Tasmania Wildfire Index 2026: preparing statewide spatial inputs, running large inference and analysis workloads, validating the results, and producing publication-ready data. This was a substantial part of my work as Lead Data Engineer.
The statewide production and analysis work ran from December 2025 to July 2026. Geoneon published Version 1.0 of the report on 20 September 2026, followed by ABC News coverage on 2 October 2026. These publication dates are separate from my production work period.
The public product was developed and funded by Geoneon, with support from Kingborough Council. My contribution centred on the underlying data and analysis, working within the team’s wider modelling and delivery effort.
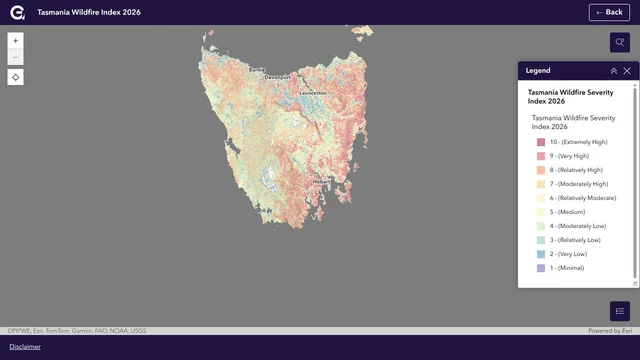
Map preview: Geoneon’s live 2026 map at statewide extent, captured 2 October 2026. The visible layer is the Wildfire Severity Index (WSI). Map and basemap credits remain visible in the image. Open the interactive map to explore severity and building exposure.
From Greater Hobart to Statewide Production
The 2026 release extends earlier Greater Hobart bushfire exposure work to Tasmania’s 29 local government areas and 769 suburbs, with 450,356 building footprints assessed. These are the coverage figures reported in the published 2026 assessment.
Scaling the work required consistent source preparation, repeatable processing and checks across large raster and vector datasets. Inputs varied in spatial resolution, coverage and completeness, so data quality and provenance remained part of the processing workflow through to delivery.
The Greater Hobart methodology v2025 provides historical context for the earlier regional product. The 2026 report is the source for the statewide release’s methodology and findings.
My Data and Analysis Contribution
I led the engineering work that turned source data and model outputs into consistent spatial products:
- Statewide input preparation: Prepared and managed Earth-observation and geospatial inputs for scalable processing, including terrain, vegetation and building data.
- Inference and analysis: Ran large inference and analysis workloads, handled raster/vector post-processing, and generated severity and exposure products.
- Building data quality: Validated spatial inputs, investigated inconsistencies and edge cases, and checked building data’s suitability for exposure analysis. Related methods are described in my building-footprint data-quality case study.
- Delivery QA: Performed consistency checks, reviewed outputs programmatically and spatially, and prepared publication-ready datasets and reporting material.
The technical challenge was carrying heterogeneous spatial inputs through a repeatable production workflow while keeping the resulting layers consistent, explainable and suitable for GIS use.
What the Published Index Shows
The release contains two complementary measures. WSI describes relative modelled landscape conditions using vegetation and fuel, terrain, and climate and dryness. WEI summarises modelled WSI conditions around assessed building footprints to describe relative exposure.
The report identifies 38,950 assessed footprints — 8.6% of the statewide total — in WEI classes 7–10. That grouping supports comparison and reporting; it is not a separate risk category. The figures describe assessed building footprints, rather than a count of homes or people.
Counts and proportional shares answer different questions: a place with many assessed buildings may have a large count in those classes, while a smaller place may have a higher share. The Version 1.0 report provides the detailed findings and interpretation guidance.
Related Council Evacuation Exposure Analysis
In July–August 2026, I also developed and ran building-level Wildfire Evacuation Exposure Index (WEEI) analysis for Hobart and Kingborough. This was a separate council delivery from the published statewide WSI/WEI release.
The work included preparing building, destination, transport-network and wildfire inputs with consistent identifiers, coordinate systems and provenance. I prepared road geometry and connectivity for graph-based analysis, supported building-to-network snapping, and validated the resulting exposure and accessibility outputs.
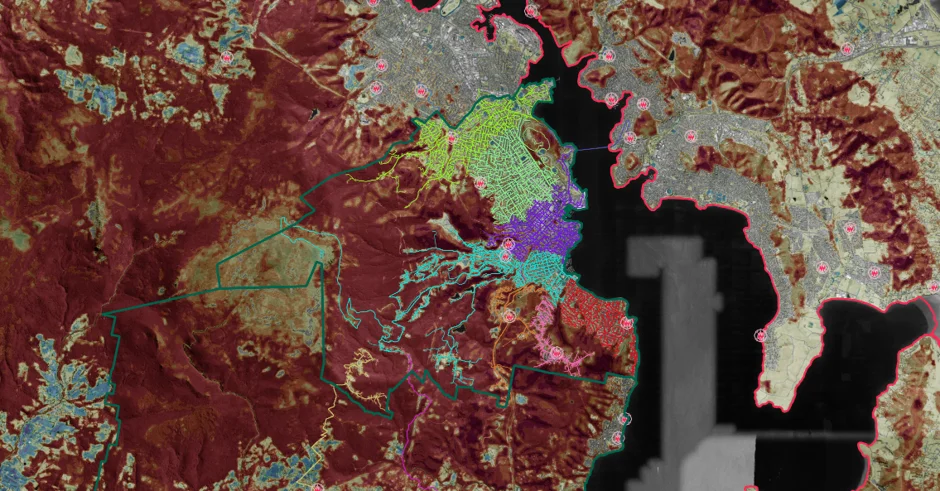
Related council analysis: transport-network and wildfire exposure work across Greater Hobart. This figure represents the council evacuation-analysis work, rather than the statewide public map.
The analysis supported longer-term planning and resilience assessment. It did not model real-time evacuation behaviour or provide instructions for leaving during an incident.
Related International Work
I also engineered wildfire severity and exposure workflows for projects in Bhutan. That work required adapting source preparation and spatial processing to a different landscape and available national and open datasets. It forms part of my broader wildfire data-engineering experience, separate from the Tasmania release.
Appropriate Use and Limitations
The statewide Index supports screening, preparedness, planning and further investigation. Its classes are relative model outputs. They do not predict ignition probability, live fire spread, current warnings or the vulnerability of a particular building; lower classes should not be interpreted as risk-free.
The Index is not an operational evacuation guide or an insurance decision tool. Refer to the report for methodology and limitations, and to Tasmania Fire Service’s preparedness resources for bushfire planning and official emergency-information links.
Case study updated 2 October 2026.