
Open Data Engineering, OSM & Building Footprint QA
Validating and conflating large-scale machine-generated building footprints against OpenStreetMap and municipal cadastres for climate hazard analysis.
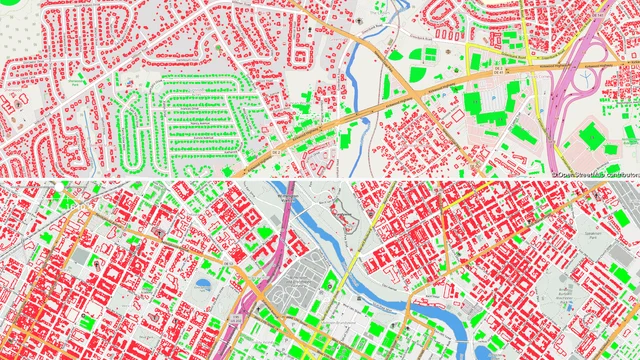
- Lifecycle
- Contributor → Engineer
- OSM Activity
- 150+ Changesets (CPoole)
- Sources
- Overture, OSM & Cadastre
- Validation
- Automated Rules + Manual QA
- python
- geospatial-data
- overture-maps
- openstreetmap
- data-quality
- gdal
- postgis
- conflation
Evidence
Overview
Large-scale open spatial datasets—such as Overture Maps and Microsoft Building Footprints—have lowered the barrier to building-level exposure and hazard modelling. However, open data is not synonymous with analysis-ready data. Machine-learning feature extraction models operating at national or continental scales introduce systematic errors: circular water tanks, grain silos, and shipping containers are frequently misclassified as habitable buildings, while shadowed structures, dense canopy covers, or rural outbuildings are omitted entirely.
At Geoneon, calculating the Wildfire Exposure Index (WEI) and Wildfire Evacuation Exposure Index (WEEI) required an accurate, building-level exposure inventory. Feeding raw, unvalidated footprint extracts directly into spatial buffer and road-network snapping pipelines skewed vulnerability statistics—either over-counting risk on uninhabited utility infrastructure or failing to account for unmapped residential properties.
This case study details the engineering methodology developed to ingest, validate, conflate, and clean building datasets across Tasmania, backed by active community stewardship on OpenStreetMap (OSM).
The Open Data Lifecycle
Rather than treating open datasets solely as free downstream inputs, my workflow connects the four stages of open data stewardship:
- Community Contributor: Maintaining active mapping activity on OpenStreetMap (
CPoole, 150+ changesets), contributing local ground-truth corrections, tracing unmapped urban and rural structures using high-resolution aerial and Mapillary street-level imagery, and aligning building geometries. - Data Consumer: Ingesting multi-source open vectors (Overture Maps GeoParquet partitions, OSM extracts via Geofabrik, and municipal open-data cadastre records) through automated, versioned ETL pipelines.
- Data Validator: Designing rule-based geometric audits, statistical outlier detection, and cross-source conflation logic to separate residential/commercial structures from auxiliary or non-building features.
- Production Engineer: Exporting auditable, schema-standardised spatial layers with persistent provenance manifests, ensuring municipal planners understand the precision and recall trade-offs inherent in the cleaned inventory.
Systematic Errors in Machine-Generated Footprints
Evaluating large-scale machine-learning footprints against Tasmanian aerial orthophotos and cadastral land use highlighted several recurring failure modes:
- Temporary and Agricultural Features: Shipping containers, temporary shade houses, hay bales and open-sided hay sheds are captured with the same confidence scores as permanent dwellings.
- Edge Merging and Splinter Polygons: In dense settlements, adjoining structures with distinct cadastre titles were occasionally merged into single undulating polygons, while detached carports generated isolated slivers.
Validation and Conflation Pipeline
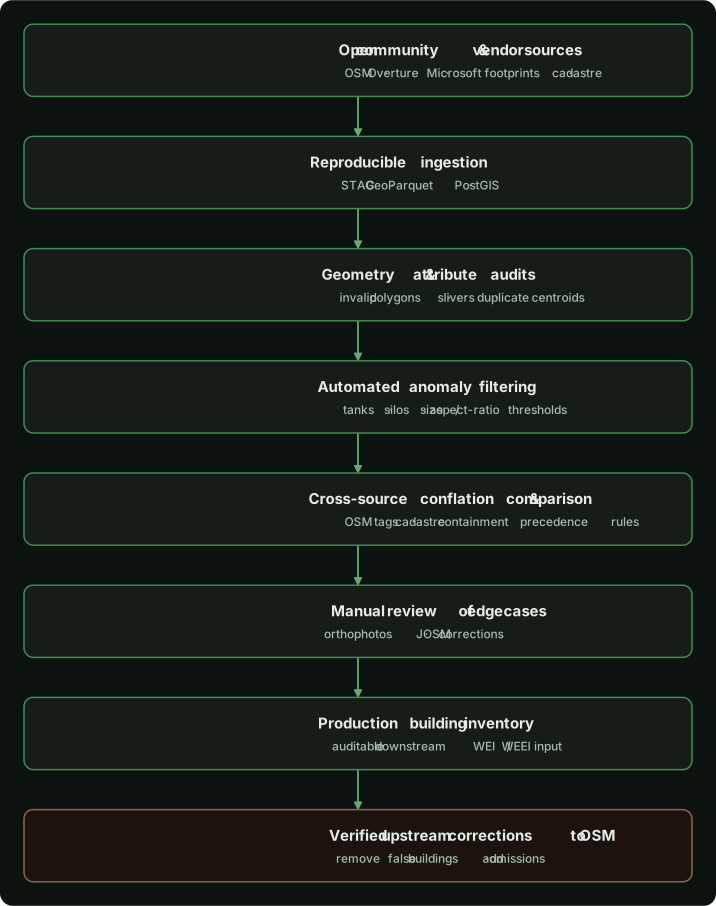
To resolve these errors systematically across municipal areas, I implemented an automated filtering and conflation pipeline in Python using PostGIS, Shapely, and GeoPandas:
1. Geometric Hygiene and Minimum Area Thresholding
- Features below physical habitable thresholds (e.g., area < 25 m²) were isolated. In rural and peri-urban zones, structures between 15 m² and 25 m² were flagged for auxiliary classification (e.g., garden sheds or pump houses) rather than primary dwellings.
- Polygons with extreme compactness ratios (e.g., Isoperimetric Quotient near 1.0 combined with high perimeter-to-area ratios) were tested against circular tank detection rules.
2. Cross-Source Conflation with OpenStreetMap
- Discrepancies between sources were logged with spatial difference masks, identifying both unmapped rural dwellings and stale geometries.
3. Cadastral and Land-Use Reconciliations
- Polygons were spatial-joined to state cadastral parcel boundaries. Footprints falling entirely within dedicated road reserves, conservation reserves without leases, or water bodies were flagged as potential false positives.
- Where parcels contained multiple overlapping polygons from different sources, an authoritative priority rule was enforced: curated council GIS layers superseded conflated OSM geometries, which in turn superseded raw ML footprints.
4. Upstream Remediation
Where systematic errors were identified during manual spot-checks or automated audits, corrections were submitted back to OpenStreetMap:
- Removing demolished or non-existent structures that persisted in outdated ML training runs.
- Adding unmapped dwellings and addressing alignment offsets using high-resolution council imagery.
Completeness vs. Precision Trade-Offs
A key engineering responsibility in open data processing is communicating the trade-offs of filtering algorithms:
- High Precision Focus: Aggressive filtering removes almost all non-building false positives (tanks, sheds, containers). However, in remote rural settlements, this can inadvertently discard small genuine dwellings, off-grid cabins, or historical structures.
- High Recall Focus: Preserving borderline features ensures no isolated dwelling is overlooked, but introduces non-habitable outbuildings that inflate structural vulnerability scores.
Engineering Takeaways
- Open data requires verification: Open datasets provide immense coverage, but cannot be treated as turnkey inputs for quantitative risk models without explicit QA.
- Conflation requires clear hierarchy: Combining open machine-learning data, community-curated data, and authoritative cadastre requires a documented precedence hierarchy and stable join keys.
- Stewardship is bidirectional: Organisations that rely on community open data gain higher data quality and lower maintenance burdens when they actively contribute validated corrections upstream.